Looking at Microsoft's Executive and Employee Compensation
There seems to be ample room for wage growth.

It’s Difficult to Meaningfully Compare Executive Compensation to Employee Earnings
A recent tall chart in Game File compared the median annual compensation of a Microsoft employee to the CEO’s reported compensation. It’s a familiar chart in executive compensation reporting, and generally in economic analyses that look at differences in worker class earnings and equity versus wage-based compensation. You certainly get the message when you reach (finally!) the bottom of the chart!
First, note one important definition, borrowing from Game File:
“For both CEO and workers, the compensation figures include salary, bonuses and stock option awards that typically don’t vest—don’t become available to the person who was granted them—until some number of years later. The ultimate size of those stock awards is often tied to the achievement of specific targets and, of course, is also affected by how valuable Microsoft’s stock is.”
It would be interesting to crunch the numbers in different ways to see if there are any other insights to draw. Here’s the information from Game File, along with percentage growth that I have calculated:

Taking that into Power BI, we get that same short chart Game File showed us:
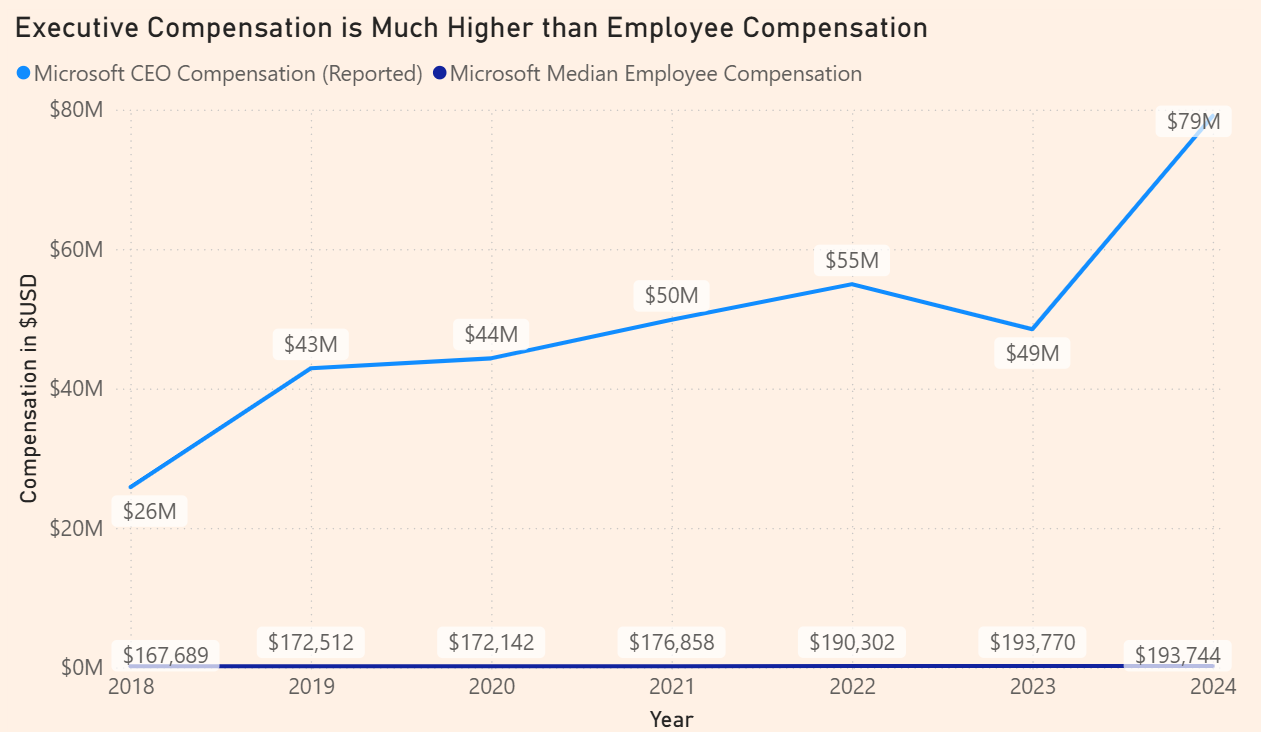
This chart clearly shows the disparity in pay between the CEO and the median worker. Where we also see a line plotting in the millions, with significant growth for the CEO, we see a second line in the hundred thousands with flat growth for workers.
Another way to look at this would be to check how compensation between the two groups has changed over time. This is a bit easier to visualize by plotting year over year percentage growth. I’ve calculated this from the chart above, and plotted it here:
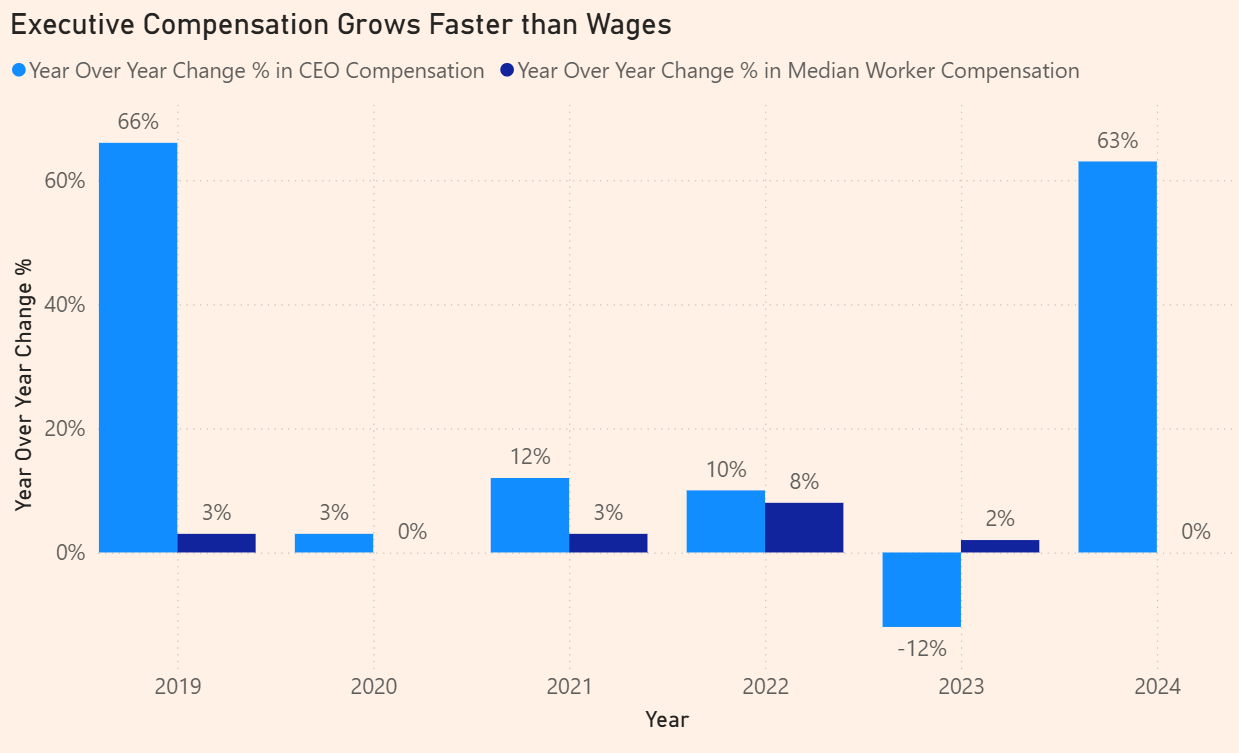
The takeaway is that executive compensation grows much faster than wage-based compensation. One defense is that the CEO’s job is a risky business: they are paid to be make the right calls regardless of whether that plays out. They’re also paid to be ON all the time. Meanwhile, the median worker’s comp doesn’t grow, but it doesn’t have too far to fall either.
What if we Base it Over Net Income?
Basing the compensation over net income reveals some more information. The CEO still gets paid much more than the median employee, yes. However, it seems that their compensation, as a proportion of net income, has been decreasing over time. Employee compensation is infinitesimally small as compared to net income, but we still notice a decreasing trend, even at 4 decimal places:
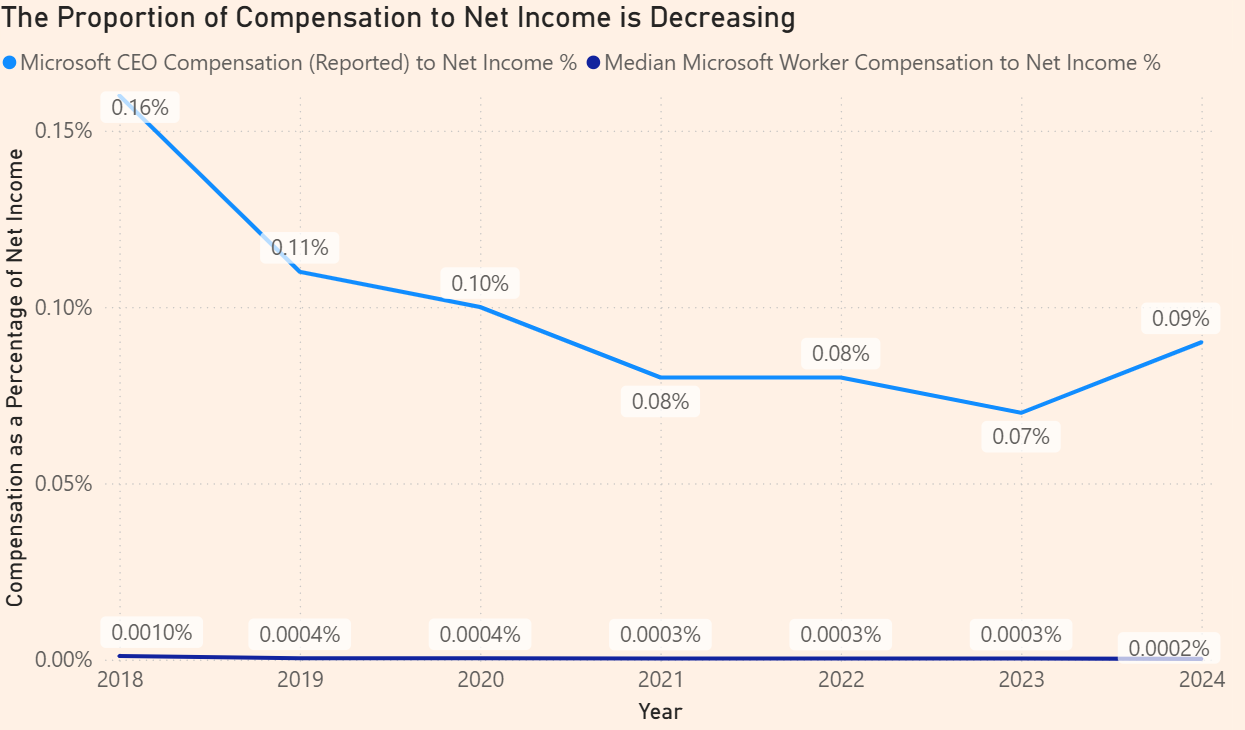
This suggests that more net income is being retained as earnings for reinvestment, or for dividends to shareholders. However, when we look at year over year percentage change from the above chart, we get some other information: it looks like growth in compensation for both groups tends to trend together, until 2024:
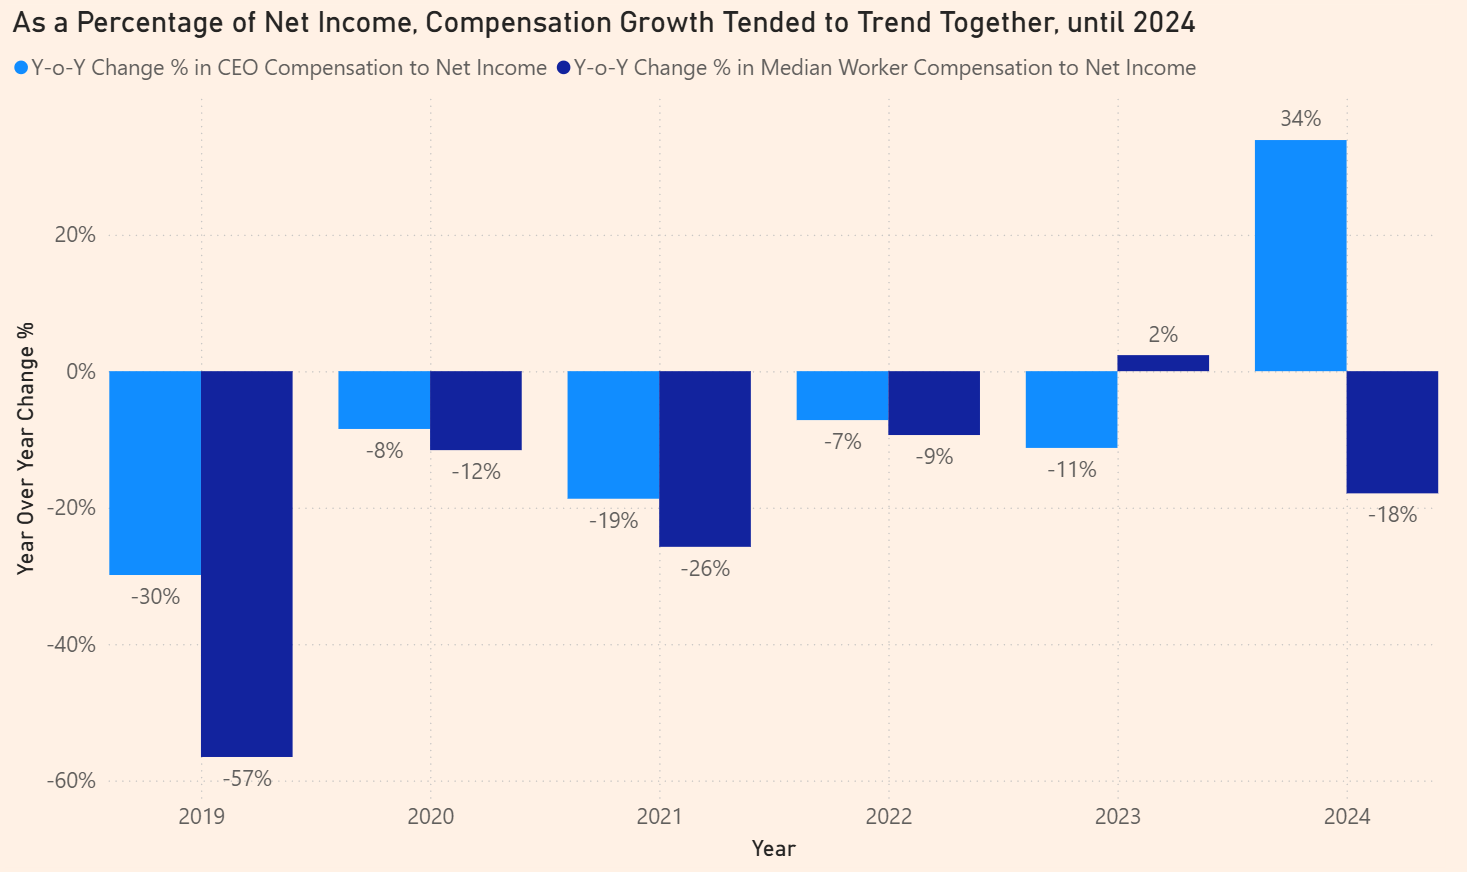
To sum up, from 2023 to 2024, it looked like median employee income was at a standstill. However, we see that it is decreasing in proportion to net income, the growth of which, ostensibly, those same employees are contributing to.
The Importance of Stock-Based Compensation
It’s important to note that executive compensation above includes more equity-based compensation than employee compensation, and as we know, equity-based compensation tied to indices, or strong stock market performers, will grow much faster than wages. For example, take this chart from Prof. Galloway:

The comparison of the S&P 500 to median income paints a very similar story to what we see when we try to compare Microsoft’s executive compensation to their median employee. Although we know that Nadella’s compensation is largely equity-based, we do not have disclosure for the median employee equity-based compensation expense. The assumption is that Microsoft employees are mainly paid in wages, and enjoy equity-based compensation to a lesser extent. Therefore, we can conclude that executives enjoy much higher growth in compensation than their regular employee counterparts, not only because of the scale of pay differential, but also because of the differing composition of equity- and wage-based compensation between groups.
So… is There Room for Wage Growth?
First, Let’s Examine Costs to Sales
To validate this further, it would be interesting to dig into total compensation to employees, but Microsoft splits this out between different income statement accounts. Looking into the latest annual reporting, we see the following info:
“As of June 30, 2024, we employed approximately 228,000 people on a full-time basis, 126,000 in the U.S. and 102,000 internationally. Of the total employed people, 86,000 were in operations, including product support and consulting services, datacenter operations, and manufacturing and distribution; 81,000 were in product research and development; 45,000 were in sales and marketing; and 16,000 were in general and administration. Certain employees are subject to collective bargaining agreements.”
Operations employees would probably be directly related to generating revenue, and would have their compensation expense included as cost of sale. R&D employees’ compensation is included in R&D expenses. Finally, support roles would be indirectly supporting revenue (finance, legal, facilities, HR, admin personnel), and so their costs are grouped as general and administrative costs.
If we can’t look at the company’s divisional employee compensation, then we will have to look at the cost groupings where those employees reside.
So, what have Microsoft’s margins been like? Let’s start with income statement data to answer this:
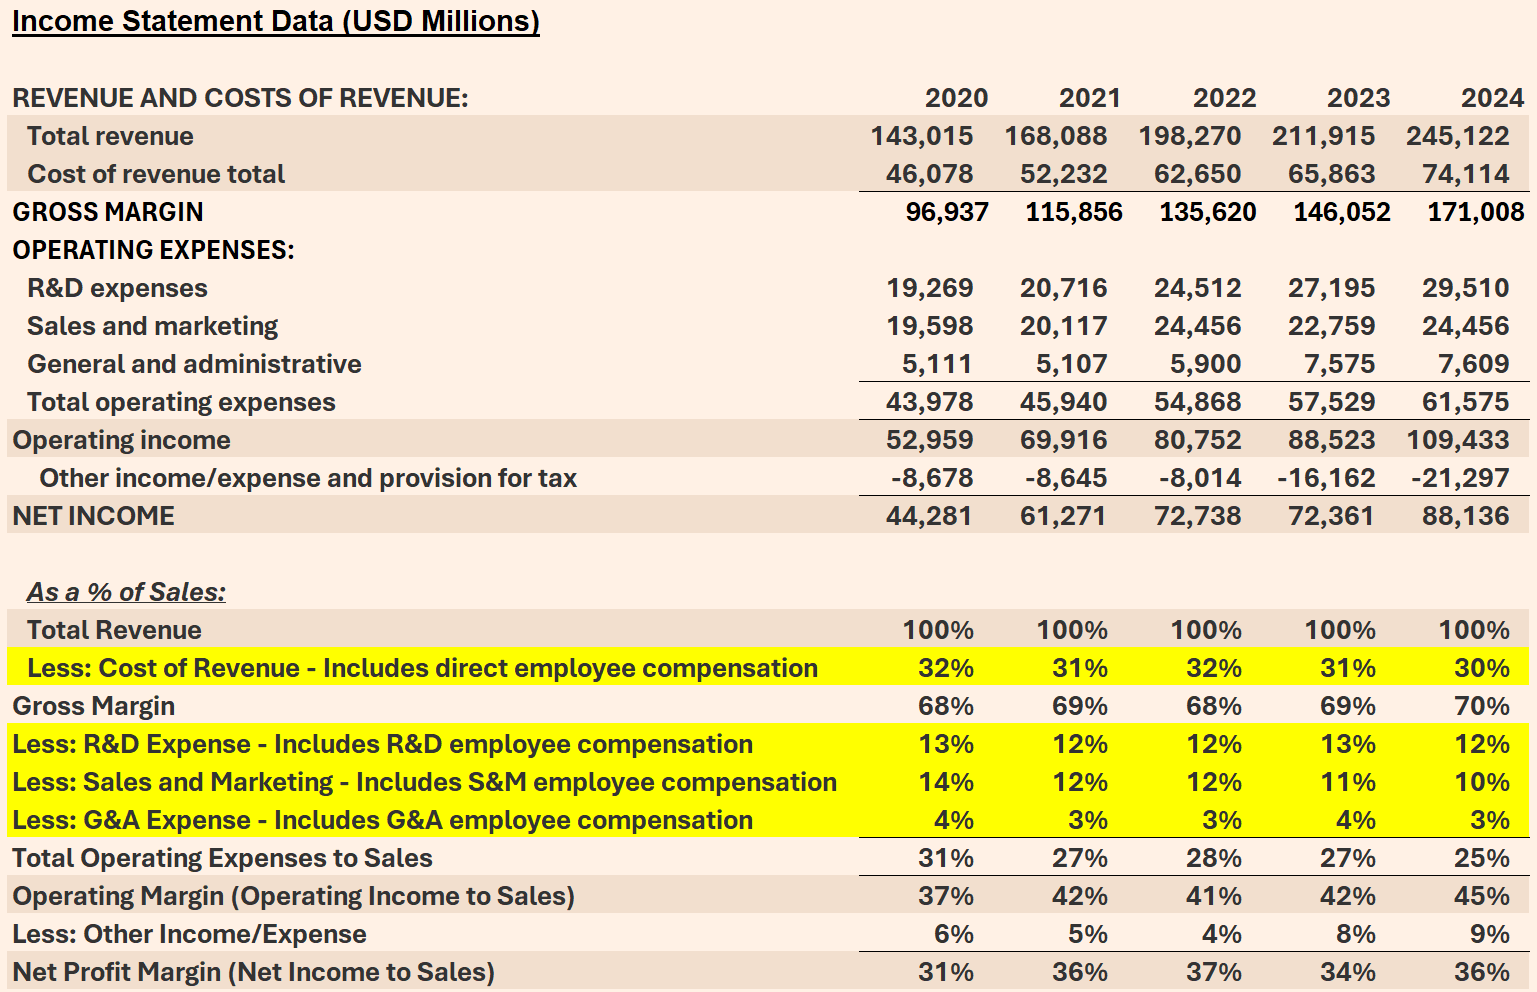
We see that Microsoft has been enjoying net profit margins of ~31%, increasing to ~36%, from 2020 to today. Above this, we also see the yellow-highlighted cost categories, which contain employee compensation.
All of these categories tend to hold a steady pattern. Costs of sales average 31% of sales, R&D expenses average 13%; Sales and Marketing average around 12%; and G&A expenses average 3%. This is probably by design; budgets include targets, and so costs are managed to reach those targets. Think: measures like several rounds of layoffs and project cancellations.
That being said, it’s not likely a pure cost cutting exercise, so much as it is a shift in Microsoft’s business priority to expand the AI segment. It also likely means further adoption of AI internally. In April 2025, Satya Nadella had already disclosed that between 20% to 30% of Microsoft’s code is written by AI, which was comparable to Google at the time. Microsoft’s CTO has predicted that AI will generate 95% of its code by 2030, but clarified that humans will be required as part of the programming process. It’s hard to dig any deeper into these statements without context, but for the moment, they are enough to support that the business priority at Microsoft is indeed shifting towards selling AI externally, and adopting AI internally.
Meanwhile, back to wages, the steady nature of the yellow-highlighted cost categories above lends more support to the notion that, while technology adoption at Microsoft is growing, employee compensation has not grown significantly over time.
Is there Competitive Pressure that would Preclude Raises?
Before closing, how does Microsoft compare to their competitors? Is competitive pressure enough of a counterweight against wage growth?
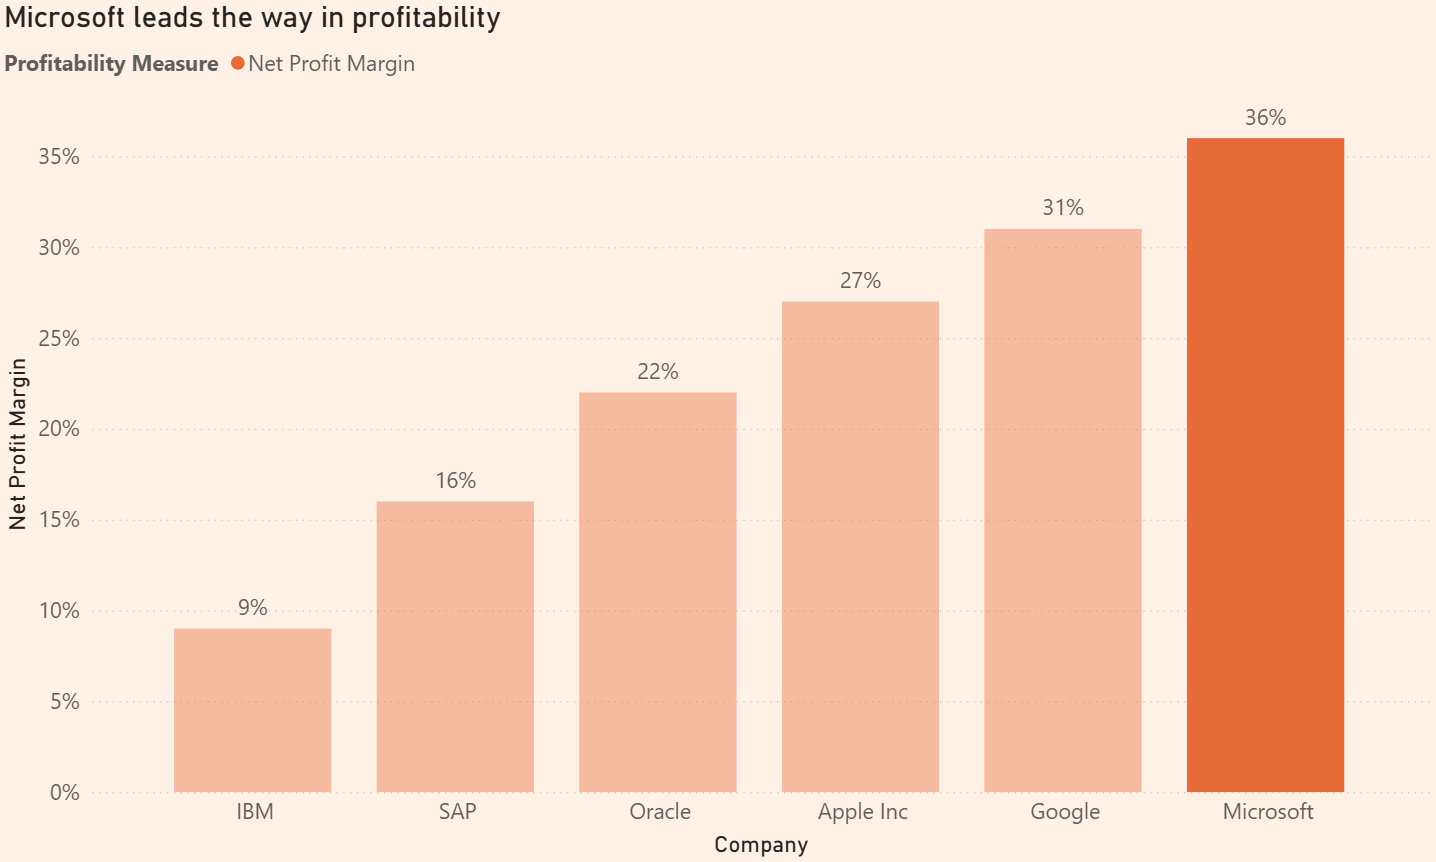
Well, no, it doesn’t seem so. They clearly lead the pack in terms of net profit:
What about the returns though? The answer: Mid.
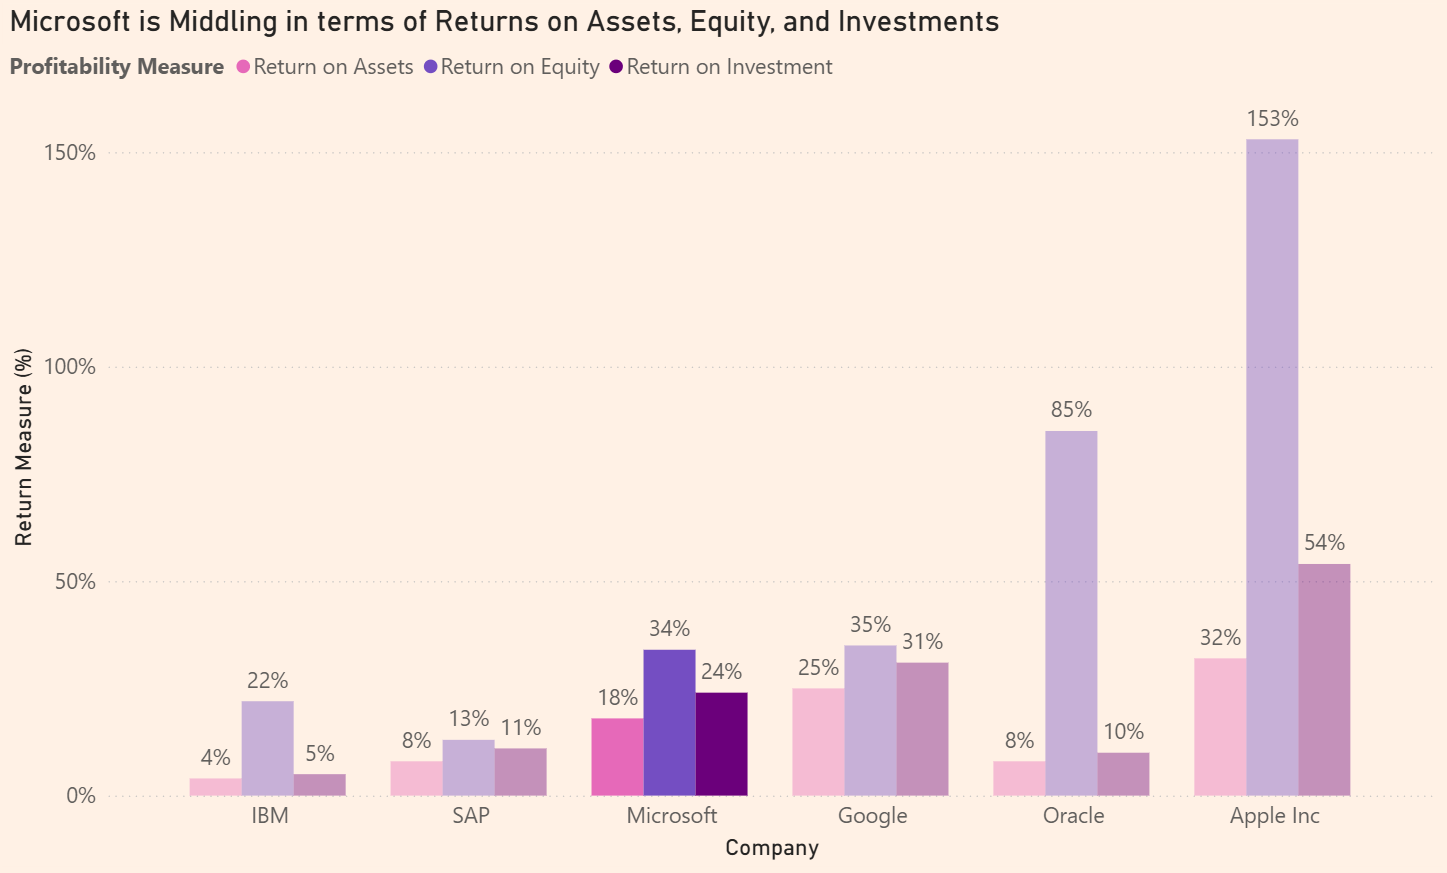
The dichotomy between net profit strength and return on asset/investment weakness explains part of why Microsoft has been so hellbent on AI. It brings promise of increased margins, and eventually, improved returns as well.
Yes, There is Room for Wage Growth
Taking it back to the wages, one thing remains certain: there is absolutely room for growth in employee compensation — and no good reason why that has not happened. The adoption of AI should not undervalue competent employees. Enforcing the use of the technology as part of performance reviews, and limiting employee compensation growth, are unethical and a dangerous combination of decisions.
Annex: Sources and Other Info
Comparing pay for Microsoft's boss and the company's workers
Microsoft to cut 4% of staff in new wave of lay-offs
https://www.microsoft.com/investor/reports/ar24/index.html
https://www.microsoft.com/investor/reports/ar21/index.html
https://www.microsoft.com/investor/reports/ar19/index.html
https://www.cordantwealth.com/microsoft/microsoft-compensation/